
actuator可以监控应用状态,但数据展示不直观,springboot admin、hystrix dashboard、turbine都集成了actuator,并提供了UI界面来展示应用状态。
springboot admin、hystrix dashboard、turbine都可以监控应用,但监控的维度不同
依赖
也可以手动添加依赖
<dependency><groupId>org.springframework.cloudgroupId><artifactId>spring-cloud-starter-netflix-eureka-clientartifactId>dependency><dependency><groupId>org.springframework.cloudgroupId><artifactId>spring-cloud-starter-netflix-hystrix-dashboardartifactId>dependency>单独作为一个服务只需要添加这两个依赖即可,如果不注册到eureka server上,也可以不要eureka client,但更推荐都把服务注册到注册中心上,通过网关统一访问。
引导类
加@EnableEurekaClient、@EnableHystrixDashboard
yml
server:port:7501spring:application:name: hystrix-dashboardeureka:client:service-url:defaultZone: http://localhost:7500/eureka/#允许访问dashboard的web页面hystrix:dashboard:#也可以指定具体的域名|ipproxy-stream-allow-list:"*"运行
启动应用,访问 localhost:7501/hystrix (hystrix dashboard的ip:port)进入hystrix dashboard的页面。
输入要监控的服务消费者的流,eg. http://localhost:8781/actuator/hystrix.stream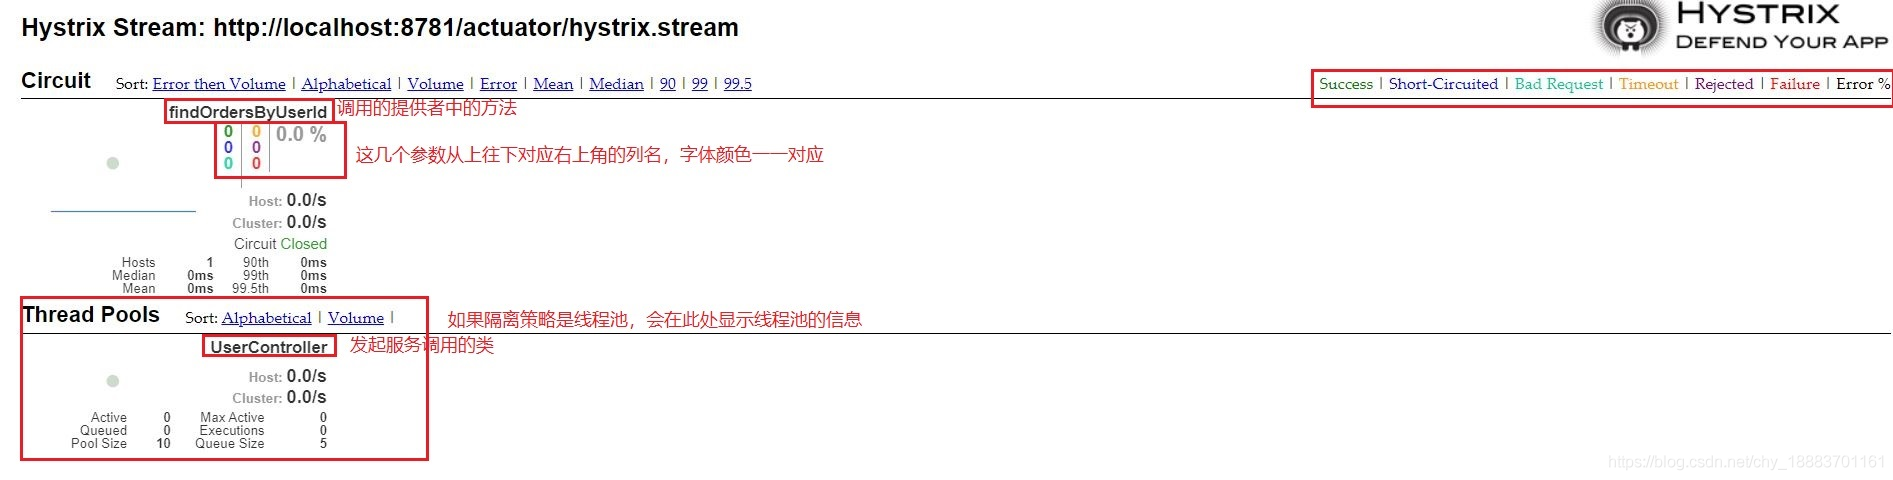
依赖
勾选Spring Cloud Circuit Breaker的2个依赖
也可以手动添加依赖
<dependency><groupId>org.springframework.cloudgroupId><artifactId>spring-cloud-starter-netflix-hystrix-dashboardartifactId>dependency><dependency><groupId>org.springframework.cloudgroupId><artifactId>spring-cloud-starter-netflix-turbineartifactId>dependency>只添加这2个依赖即可。
turbine监控的服务集群信息是对hystrix dashboard监控的服务节点信息的聚合、统计,是建立在hystrix dashboard之上的,使用的仍是hystrix dashboard的web页面。
引导类
加@EnableEurekaClient、@EnableHystrixDashboard、@EnableTurbine
yml
server:port:7502spring:application:name: turbineeureka:client:service-url:defaultZone: http://localhost:7500/eureka/#允许访问dashboard的web页面hystrix:dashboard:#也可以指定具体的域名|ipproxy-stream-allow-list:"*"turbine:#要监控的服务,有多个时逗号分隔app-config: user-server,order-servercluster-name-expression: new String("default")#以host+port区分服务节点。默认只以host来区分服务节点combine-host-port:true运行
启动应用,访问 localhost:7502/hystrix (turbine的ip:port)进入turbine的页面。
输入turbine的流,eg. http://localhost:7501/turbine.stream,会显示yml中配置的所有服务集群的信息。
可直接在浏览器地址栏输入流的url查看原始数据。